Entity PAI Tables Do Not Seem to Show Us the Way Yet. What Will It Take to Improve?
Cas Bemelmans
Consultant - Sustainable Finance, The Netherlands,The Netherlands
Sander Boleij
Associate Director – Sustainable Finance,The Netherlands
Consulting
For the first time, financial institutions recently released their so-called 'statement of Principal Adverse Impacts (PAI) on sustainability factors'. This statement, also known as the ‘Entity PAI Table’, is a legal requirement under the Sustainable Finance Disclosure Regulation (SFDR). It should help end-investors to better compare the negative sustainability impacts of investments by financial institutions. A first look at these disclosures, however, shows that we are still a long way off from achieving the desired improvements that will help investors.
Toward more transparent disclosures
Since the European Commission formulated its Action Plan for Sustainable Finance in 2018, many new European regulations for financial institutions have seen the light. One of these regulations is the Sustainable Finance Disclosure Regulation (SFDR).
SFDR is aimed at improving transparency in the market for sustainable investment products, preventing greenwashing, and false sustainability claims by market participants. In principle, SFDR applies to financial market participants (e.g., banks and investment firms), financial advisers that provide investment advice, and life insurers with insurance-related investment products. One of the mandatory SFDR disclosures that financial institutions in scope of SFDR need to make, is the so-called entity PAI table.
The Entity PAI table
The Entity PAI Table is a regulator-defined disclosure that summarises the Principal Adverse Effects caused by a financial institution because of its investments. It consists of three sub tables with 64 indicators and covers a wide range of sustainability impacts. Examples of these indicators are carbon emissions, biodiversity impacts, hazardous waste ratios, board gender diversity, and violations of the OECD Guidelines for Multinational Enterprises. The first sub table, consisting of 18 indicators, needs to be published completely; for sub tables 2 and 3 the requirement is to disclose at least one indicator for each table.
Our analysis
As the publication date of the first entity PAI tables was 30 June 2023, the opportunity arose to conduct a thorough analysis. The main research questions we posed were: do the PAI tables contain the information we would expect beforehand? And does this lead to the desired increase in transparency and comparability of the disclosure information? To find out, we examined the recently published PAI entity tables of nine Dutch mutual fund providers. Ultimately, the analysis let to the main findings, all stated below.
Finding #1: Many investee data is still missing
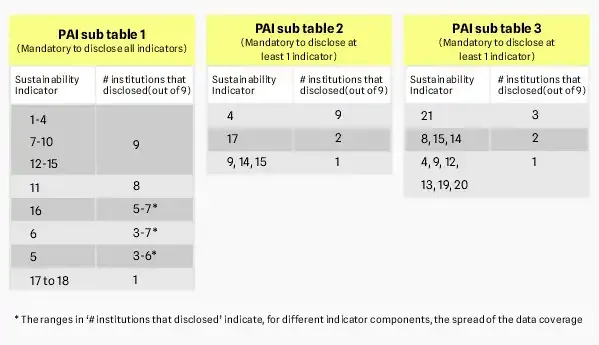
Although the nine financial institutions provided a substantial amount of sustainability data, not all mandatory indicators, to be presented in PAI sub table 1, were covered. As can be seen from Figure 1, all nine institutions disclosed PAI data in relation to indicator 1 to 4, 7 to 10 and 12 to 15 of PAI sub table 1. For the rest of the PAI indicators of sub table 1, only a portion of the institutions were able to deliver the required PAI data: disclosure percentages vary from 11% to 89% of the institutions.
Figure 1 also shows what choices the institutions made regarding the PAI sub tables 2 and 3. For these tables, institutions were required to report at least one indicator per sub table. Most of the institutions (seven out of nine) closely followed the regulation and published exactly one indicator for sub table 2 and 3. Interestingly, in PAI sub table 2, almost all institutions reported on indicator 4. For PAI sub table 3, institutions were less unanimous and chose a total of 10 different indicators.
It is important to underscore that the numbers shown in Figure 1 only indicate for which PAI indicators financial institutions have published data. However, these numbers don’t say anything about the data coverage at the investee level. Several institutions have indicated that, for several indicators, data coverage at the investee level is low. Only two out of nine institutions have published (on a voluntary basis) data coverage percentages per PAI indicator. These percentages vary from 2% to 100% but seem to average below 40%. This implies that caution is required when interpreting entity PAI tables. Because - to illustrate - what does it mean if the reported 'emissions to water (in tonnes) generated by investee companies, per million EUR invested' turn out to be 3.09, if this figure is covering only 2% of all investee companies?
Finding #2: PAI reports deviate from the requirements
Although most institutions have followed the prescribed structure of the entity PAI table, we can observe some deviations as well. In some cases, these deviations seem to arise from different interpretations of what was requested by the legislator. Three examples of this include:
- For PAI indicator 6 (energy consumption intensity by high impact climate sector), some parties report nine different figures (one for each sector), while others have added up all these figures to just one figure (for all sectors combined). Readers who would like to make a sector-level comparison are thus disappointed here.
- In PAI indicator 11, only one word seems to cause problems: ‘or’. The regulator here asks for the ‘share of investments in investee companies without policies to monitor compliance with the UNGC principles or OECD Guidelines for Multinational Enterprises OR grievance/complaints handing mechanisms to address violations of the UNGC principles or OECD Guidelines for Multinational Enterprises’. Most institutions report just one figure here, but some have apparently interpreted the 'or' to report two figures -- one for policies and one for grievance mechanisms.
- For some PAI indicators, the problem lies in the reporting units used. See, for example, PAI indicator 15 -- GHG intensity of investee countries. The unit to be used here is tonnes CO2e/MEUR, but we also see Ktonnes CO2e/MEUR in the disclosures. So, any inattentive reader could easily miscalculate by a factor of 1000 here. Furthermore, we found one institution that reported this indicator in dollars (instead of euros). Anyone who fails to notice this is immediately mistaken by 10% in monetary value at the current EUR/USD exchange rate.
Finding #3: PAI reports lack explanation
Some PAI indicators show outcomes or figures that are difficult to interpret, even after reading the added textual explanation. Take, for example, the ‘average corruption score’ of PAI sub table 3. Three out of nine institutions have reported this average corruption score. The corresponding figures are 69.89, 69.69 and 1.65. What is striking is that two figures are very alike while the third figure is clearly different. Looking at the textual explanations in the PAI tables, the first two institutions seem to have used the same data source and method. But the explanation of the third institution is so general that the reader gets little to nothing out of it. So, without good explanation, entity PAI tables will not help in gaining better sustainability insights.
Finding #4: PAI reports contain unrealistic outcomes
The fact that PAI outcomes differ between financial institutions is quite plausible. But, if differences become too large and cannot be easily explained, doubts about the accuracy of these figures will increase. In this context, see Figure 2. Here we have indicated for three PAI indicators the highest, lowest, and average figures published by the nine institutions examined.
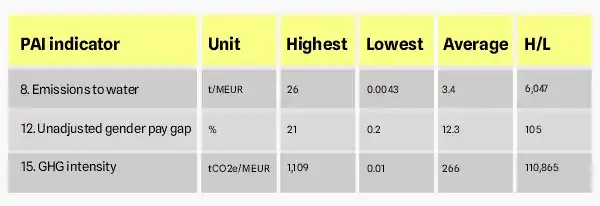
Emissions to water: As per the table, reported outcome show enormous discrepancies. From the disclosures it remains unclear what has caused these differences. But as discussed before, the reliability of these figures is doubtful as data coverage percentages are only 2% to less than 4%.
Unadjusted gender pay gap: Here, the large difference between highest and lowest reported figures also raises questions. But the fact that one of the institutions reports a gap of only 0.2% is thought-provoking as such gaps are usually considerably larger. In any case, the explanation added by the institution offers little added value as it only states that any inconsistencies in the methods used by individual investees may have affected the reported figure of 0.2%.
GHG intensity: It does not seem plausible that the CO2 intensity of countries (expressed per million euros of assets invested in these countries) differs more than 110,000 times. Probably, these remarkable differences are rather explained using different data sources or calculation methods. Or, as was already indicated (see our Finding #2 above), by using different measurement units and exchange rates. Unfortunately, this is only a matter of conjecture, partly because the institutions have given little additional explanation.
How to best move forward? Summing up the above, the first set of entity PAI tables as disclosed in June 2023, is not yet going to satisfy the readers. There is too much missing data, there are no solid explanations for each indicator, and the differences between institutions are too big to be credible. Hence, there is still a lot of work to be done.
We believe all parties involved could do more. Here are some of our suggestions:
- Corporations -- could disclose more and better sustainability data. We expect that the upcoming Corporate Sustainability Reporting Directive (CSRD) and the European Sustainability Reporting Standards (ESRS) will help here.
- ESG data providers -- could better harmonise the sustainability data that they collect from corporates/investees, such that PAI table outcomes will become less dependent on the provider chosen. They could also speed up their disclosure processes as we know that quite some PAI data is still from 2020 or even before.
- Financial institutions -- could improve their disclosures by adding more in-depth and meaningful explanations on (calculation) methods used.
- Regulators -- could provide more guidance and clarity, as financial institutions are interpreting several indicators in different ways.
A final thought
Finally, there is one last thought that we would like to share. It is not addressed to any of the stakeholder groups, but to everyone. What is the added value of a PAI table in relation to the reference year 2022 if it only covers a fraction of the relevant investee data and includes many data points from 2019 and 2020? We therefore recommend that institutions continue to update the 2022 entity PAI table annually until all data gaps have been filled and all data used relate to the year 2022. To date, the regulator is not pursuing this track, but what’s stopping us?
The Author

Cas Bemelmans
Consultant - Sustainable Finance, The Netherlands
As a Sustainable Finance Consultant, Cas advices financial institutions on challenges related to ESG strategies, data management, and sustainability reporting and disclosures. He is equipped with experience in data warehouse solutions for ESG reporting, materiality assessments, and sustainability due diligence for mergers and acquisitions.
Contact the author at: cas.bemelmans@synechron.com

Sander Boleij
Associate Director – Sustainable Finance
As Associate Director, and a Sustainable Finance expert with Synechron the Netherlands, Sander advises financial institutions on their sustainability challenges. Recent examples center around the implementation of new sustainability legislations, the calculation of physical climate risks and the efficient management of ESG data by using innovative technologies.
Contact the author at: sander.boleij@synechron.com